Your website receives steady traffic, but conversions remain stubbornly low. Visitors land on your pages, browse for a few seconds, and leave without taking action. The problem isn’t always your offer or pricing.
Often, invisible friction points in your user experience are silently driving potential customers away. This is where heatmaps become your diagnostic tool, revealing exactly how users interact with your site and where they encounter obstacles.
Understanding the Connection Between UX Design and Website Conversions
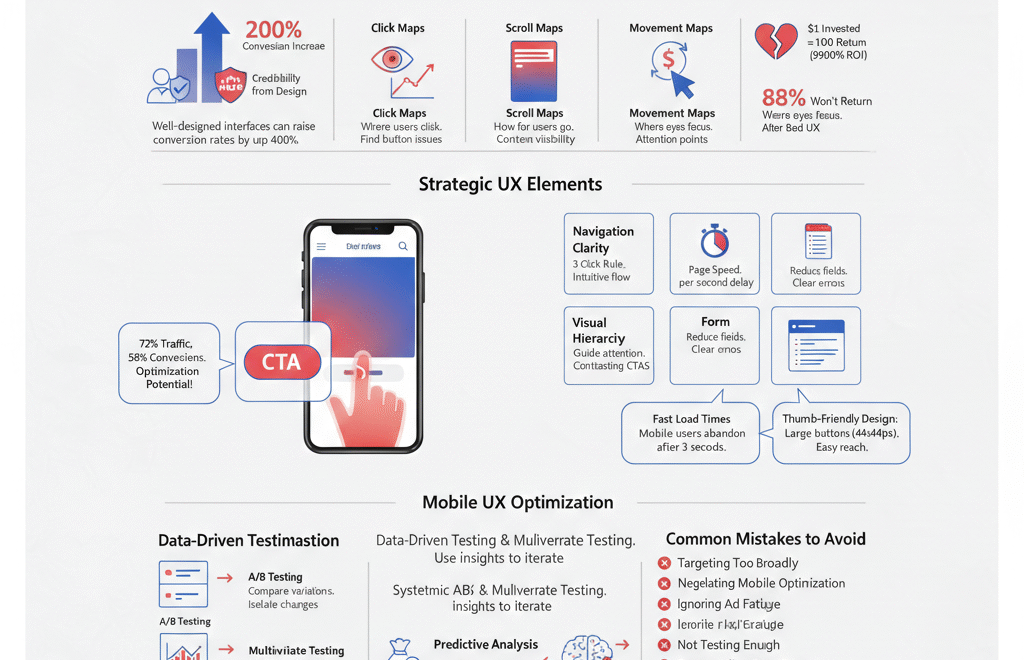
User experience design directly impacts your bottom line. Research demonstrates that well-designed interfaces can raise conversion rates by up to 200%, while combining this with excellent UX pushes that figure to 400%.
Every dollar invested in UX design potentially yields a return of $100, representing a 9,900% ROI. These numbers position UX not as a design afterthought, but as a critical business investment that directly influences revenue.
The relationship works through several mechanisms. Enhanced trust builds credibility, with 75% of a website’s perceived credibility stemming from its design. Improved customer loyalty creates returning customers and brand advocates. Superior UX distinguishes your brand in crowded markets, providing advantages in customer acquisition and retention.
When visitors encounter usability issues or confusing navigation, 88% of online customers are less likely to return after a bad experience. This creates a self-reinforcing cycle where better experiences drive higher conversion rates, generating revenue that funds additional improvements.
What Heatmaps Reveal About User Behavior and Conversion Barriers
Heatmaps visualize user interactions through color-coded representations of where visitors click, scroll, and focus attention. Red areas indicate high engagement, while blue zones show neglected sections.
This visual intelligence goes beyond traditional analytics. While Google Analytics tells you how many visitors bounce, heatmaps show you exactly why they leave. Quality heatmap analysis can transform a 2% conversion rate into 5%, representing a 250% increase in business performance.
Three primary heatmap types provide distinct insights. Click maps track where users tap or click, revealing whether your call-to-action buttons receive attention or if visitors click non-interactive elements expecting a response.
Scroll maps measure how far down pages users travel before abandoning content. If critical conversion elements sit below typical scroll depth, they remain invisible to most visitors. Movement maps track cursor patterns, showing where eyes focus and which content captures sustained attention.
These tools identify specific friction points causing user frustration. Rage clicks occur when visitors repeatedly click an element that doesn’t respond, signaling broken functionality or misleading design. Dead clicks happen when decorative elements appear interactive but serve no function. Error clicks result when actions produce unexpected outcomes, like broken links landing on 404 pages.
Strategic Elements to Improve UX for Higher Website Conversions
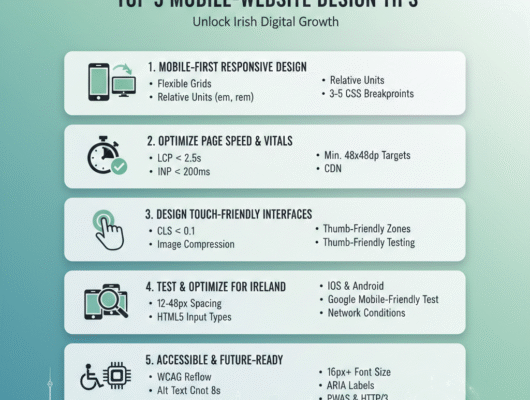
Conversion optimization requires systematic attention to key design elements that guide visitor behavior. Navigation clarity ensures users find information within three clicks, following the three-click rule that reduces friction in the user journey.
Intuitive menu structures with logical page flow prevent visitors from feeling lost. Research shows that 38% of people stop engaging with websites they find unattractive, while 94% of first impressions are design-related.
Page speed optimization becomes critical when considering that every second of delay reduces conversions by 7%. Compress images using modern formats like WebP, implement content delivery networks for faster loading, and ensure mobile responsiveness across all devices. Companies lose approximately $2.6 billion annually due to slow loading times.
Visual hierarchy guides attention through strategic use of contrasting colors, varied font sizes, and appropriate spacing. Place primary call-to-action buttons where users naturally focus, typically center screen or within the direct content flow.
Form simplification prevents abandonment at critical conversion points. Reduce required fields to essentials, provide clear error messages, and consider multi-step forms for complex submissions. Professional web development ensures these elements work seamlessly together.
How to Use Heatmap Data to Identify Conversion Leaks
Effective heatmap analysis follows a structured approach. Begin by defining clear goals for each page. Homepage goals might focus on navigation to key sections, while product pages aim for add-to-cart actions.
Install comprehensive tracking that captures click patterns, scroll depth, and session recordings. Segment data by device type, traffic source, and user demographics to identify behavior variations across audience groups.
Analyze scroll depth metrics to understand content visibility. Average scroll depth between 50-70% indicates typical engagement, while depths below 25% signal above-the-fold content fails to capture interest. If conversion elements appear at 80% scroll depth but users abandon at 40%, repositioning becomes essential.
Examine click concentrations to verify button effectiveness. High click density on calls-to-action confirms proper placement, while scattered clicks on non-interactive elements indicate design confusion. Watch for rage click clusters, which reveal user frustration from unresponsive buttons or misleading visual cues.
Session replay features complement heatmap data by showing individual user journeys. Watch recordings where users abandoned checkout processes or struggled with forms. These qualitative insights explain the quantitative patterns revealed in aggregate heatmap data.
Optimizing Call-to-Action Placement Through User Behavior Insights
Call-to-action buttons serve as conversion catalysts, but placement determines effectiveness. Heatmap analysis reveals optimal positioning based on actual user attention patterns rather than assumptions.
Above-the-fold placement captures immediate attention from visitors who don’t scroll. However, strategic positioning accounts for natural reading flow. Western audiences read top-to-bottom and left-to-right, making bottom-right placements psychologically comfortable for action-taking.
Multiple CTA placements accommodate different user behaviors. Place one button above the fold for quick converters, another mid-page after benefit descriptions, and a final one at content conclusion. Longer pages justify more CTAs, ensuring visibility regardless of scroll depth.
Button design elements significantly impact performance. Use contrasting colors that pop against background hues, ensuring buttons stand out without clashing. Action-oriented text like “Start Free Trial” or “Get Instant Access” outperforms generic phrases like “Submit” or “Click Here.”
Surrounding whitespace draws attention to CTAs by eliminating visual clutter. Test button sizes that balance prominence with page aesthetics, typically making primary CTAs larger and bolder than secondary actions. Digital marketing strategies leverage these insights to maximize conversion potential.
Mobile UX Optimization for Conversion Rate Improvement
Mobile commerce accounts for 72% of ecommerce traffic but only 58% of conversions, indicating massive optimization potential. Mobile heatmaps reveal touch interaction patterns that differ fundamentally from desktop mouse movements.
Touch heatmaps distinguish between taps, swipes, and pinch gestures, enabling optimization based on actual mobile behavior. Buttons require larger tap targets, typically 44×44 pixels minimum, to accommodate finger precision limitations.
Thumb-friendly design positions critical elements within easy reach of single-handed use. Primary actions should appear in lower screen portions where thumbs naturally rest. Navigation menus adapt to thumb zones, avoiding top-corner placements that require hand repositioning.
Form optimization becomes crucial on mobile devices. Implement appropriate keyboard types for each field, reducing input friction. Use auto-fill capabilities and consider alternatives like social login to minimize typing on small screens.
Page speed matters even more on mobile networks. Compress images aggressively, lazy-load below-the-fold content, and minimize JavaScript execution time. Mobile users abandon pages that take longer than three seconds to load, making performance optimization essential for local SEO success.
Reducing Friction Points That Kill Website Conversions
Friction occurs anywhere user progress slows or stops. Identifying and eliminating these obstacles directly improves conversion rates through smoother user journeys.
Navigation confusion creates immediate friction. Unclear menu labels, hidden navigation elements, or inconsistent page structures force users to hunt for information. Implement breadcrumb navigation showing location within site hierarchy, use descriptive link text, and maintain consistent navigation across all pages.
Form friction manifests through excessive fields, unclear error messages, or unexpected validation requirements. Indicate required fields clearly, provide real-time validation feedback, and explain why information is needed. Consider progress indicators for multi-step forms, reducing abandonment through transparency.
Trust signals reduce psychological friction. Display security badges near payment forms, showcase customer testimonials strategically, and provide clear return policies. Professional design elements convey reliability and attention to detail, encouraging users to complete conversions confidently.
Technical friction includes broken links, error messages, or non-functioning features. Regular testing identifies these issues before they impact significant traffic. Monitor JavaScript errors through browser consoles, implement comprehensive quality assurance processes, and maintain updated content.
Implementing Data-Driven Testing for Continuous UX Enhancement
Conversion optimization represents an ongoing discipline rather than one-time fixes. Systematic testing validates hypotheses and drives iterative improvements based on user response data.
A/B testing compares two page versions to determine which performs better. Test single variables like button color, headline copy, or CTA placement to isolate what drives improvement. Run tests long enough to achieve statistical significance, typically requiring several hundred conversions per variation.
Multivariate testing examines multiple elements simultaneously, identifying optimal combinations. While more complex, this approach reveals interaction effects between design elements. Test headline and CTA combinations to discover which pairings resonate most strongly.
Heatmap analysis informs test hypotheses. If scroll maps show users abandoning before critical content, test moving key information higher on pages. When click maps reveal ignored CTAs, experiment with different colors, sizes, or positioning.
Establish clear success metrics before testing. Define primary goals like completed purchases, form submissions, or email signups. Track secondary metrics including time on page, scroll depth, and bounce rate to understand full user experience impact.
Document findings systematically, building organizational knowledge about what works for your specific audience. Failed tests provide valuable insights, revealing approaches that don’t resonate. SEO services benefit from these learnings by aligning technical optimization with proven conversion patterns.
Advanced Heatmap Features That Drive Revenue Growth
Modern heatmap platforms incorporate AI-powered analysis and revenue attribution, moving beyond basic click visualization. These advanced capabilities connect user behavior directly to business outcomes.
Revenue heatmaps assign monetary value to specific page elements. See which product images generate highest-value clicks, which navigation paths lead to premium purchases, and which content sections drive repeat customer engagement. This insight enables prioritization based on financial impact rather than traffic volume alone.
Predictive analysis uses machine learning to identify optimization opportunities before they become obvious. AI-driven heatmap analysis detects subtle patterns indicating user confusion, predicts which design changes will improve conversions, and surfaces insights that manual review might miss.
Funnel integration shows exactly where users drop from conversion paths. Combine heatmap insights with funnel analytics to understand why users abandon at specific stages. If checkout abandonment occurs consistently at payment information entry, heatmaps reveal whether design elements cause hesitation.
Real-time optimization enables rapid response during high-traffic events. Monitor behavior during campaigns, identify emerging friction points immediately, and implement fixes while traffic remains elevated. This agility produces 67% higher conversion improvements compared to delayed optimization cycles.
Conclusion
Heatmaps transform invisible user behavior into actionable conversion insights. By revealing exactly how visitors interact with your site, these tools eliminate guesswork from UX optimization.
The combination of heatmap analysis and strategic design improvements creates a powerful framework for conversion growth. Start by implementing comprehensive tracking, analyze patterns systematically, test hypotheses rigorously, and iterate continuously based on results.
Success requires commitment to data-driven decision-making over assumptions. Your users show you exactly what works through their behavior. Listen to that feedback, remove friction from their journey, and watch conversion rates climb as experience improves.
Ready to transform your website’s performance? Schedule a free consultation to discover how professional UX optimization can boost your conversions and drive sustainable business growth.